The not-for-profit organization the Urban Institute created an incredible dataset on State-by-State Spending on Kids that is available here. This data package provides this dataset through R. It is formatted as tidy data to facilitate analysis within the tidyverse suite of R packages.
Installation
You can install {tidykids} only from GitHub with:
remotes::install_github("jrosen48/tidykids")Use
First, load the {tidykids} package:
Then, type tidykids to load the data:
tidykids
#> # A tibble: 23,460 × 6
#>    state                expenditure year       raw   inf_adj inf_adj_perchild
#>    <chr>                <chr>       <chr>    <dbl>     <dbl>            <dbl>
#>  1 Alabama              PK12ed      1997   3271969  4665308.            3929.
#>  2 Alaska               PK12ed      1997   1042311  1486170             7548.
#>  3 Arizona              PK12ed      1997   3388165  4830986.            3707.
#>  4 Arkansas             PK12ed      1997   1960613  2795523             3891.
#>  5 California           PK12ed      1997  28708364 40933568             4282.
#>  6 Colorado             PK12ed      1997   3332994  4752320.            4380.
#>  7 Connecticut          PK12ed      1997   4014870  5724568.            6697.
#>  8 Delaware             PK12ed      1997    776825  1107629.            5625.
#>  9 District of Columbia PK12ed      1997    544051   775730.            6105.
#> 10 Florida              PK12ed      1997  11498394 16394885             4454.
#> # ℹ 23,450 more rows
Note that:
-
staterefers to the United States state (including the District of Columbia) -
yearrefers to the year -
rawrefers to the raw amount spent -
inf_adjrefers to the amount transformed to be in 2016 dollars for each year spent -
inf_adj_per_childrefers to the amount transformed to be in 2016 dollars for each year per child in $1000s spent
Detailed descriptions of the expenditures in the dataset (see the expenditure column) are available in the tidykids-codebook vignette.
Example
The data can prepared for other analyses or be visualized, as below:
library(dplyr, warn.conflicts = FALSE)
library(ggplot2)

tidykids %>%
  filter(expenditure %in% c("PK12ed"),
         state %in% c("Alabama", "Florida", "Georgia", "Mississippi", "North Carolina", "South Carolina", "Tennessee", "Virginia")) %>%
  ggplot(aes(x = year, y = inf_adj_perchild, color = state, group = state)) +
  geom_point() +
  geom_line() +
  theme(axis.text.x = element_text(angle = 90, vjust = 0.5, hjust=1)) +
  scale_color_brewer(type = "qual") +
  xlab(NULL) +
  ylab("$1000s") +
  labs(title = "Elem. and secondary education expenditures per child",
subtitle = "For select states in the Southeastern United States") 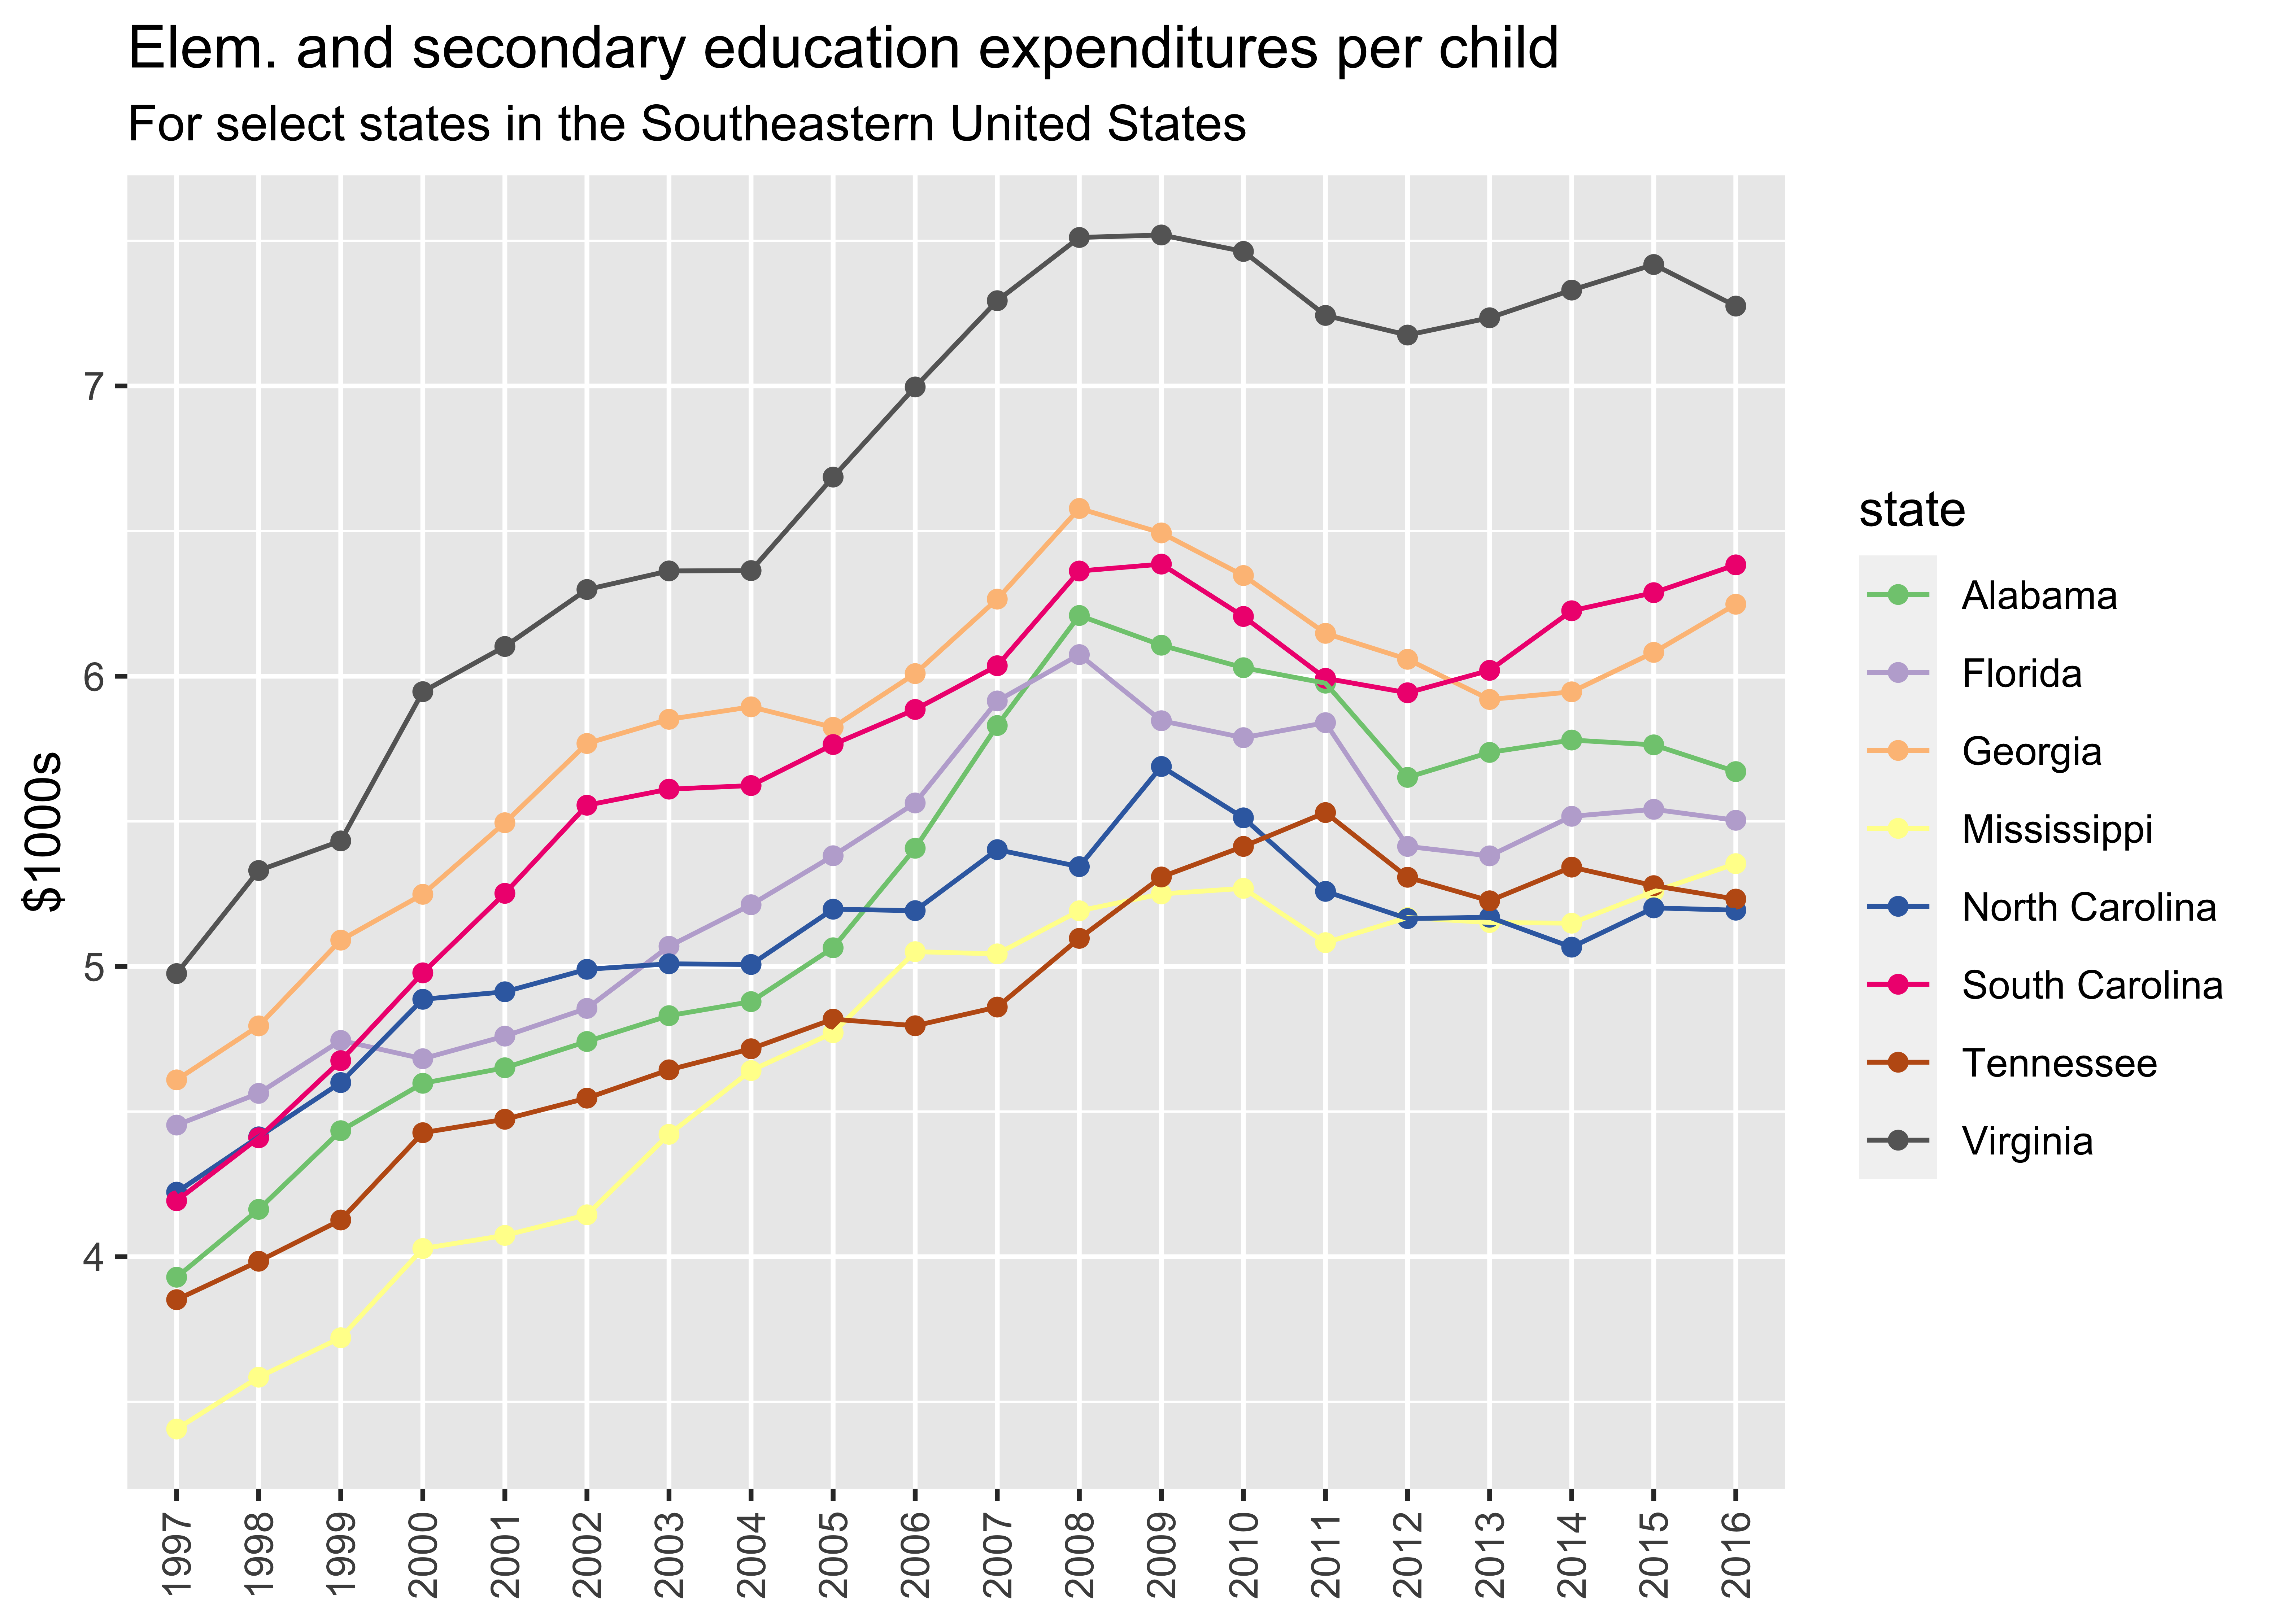
Shiny
An interactive Shiny web application is available here: https://jmichaelrosenberg.shinyapps.io/tidykidsshiny/
Attribution
The data was made available by and is attributable to Julia Isaacs, Eleanor Lauderback, and Erica Greenberg under the under the [ODC Attribution License](https://opendatacommons.org/licenses/by/1-0/.